Transform Excel Spreadsheets into Interactive Dashboards — In Minutes, Not Hours
Stop manually building charts in Excel. Upload your spreadsheet and let AI instantly convert it into a stunning, interactive dashboard with real-time updates.
Trusted by over 10,000 companies worldwide to transform Excel data into professional dashboards.
Excel Chaos Is Holding Your Team Back
Your team spends hours each week updating Excel files, manually creating charts, and struggling with version control. Charts break, formulas fail, and data gets out of sync. Everyone ends up with different versions of the "latest" report.
Data teams and analysts deserve better than wrestling with Excel's limitations. You need dashboards that update automatically, look professional, and actually help people make decisions.
How Your Data Looks in Excel vs AgentUI Dashboards
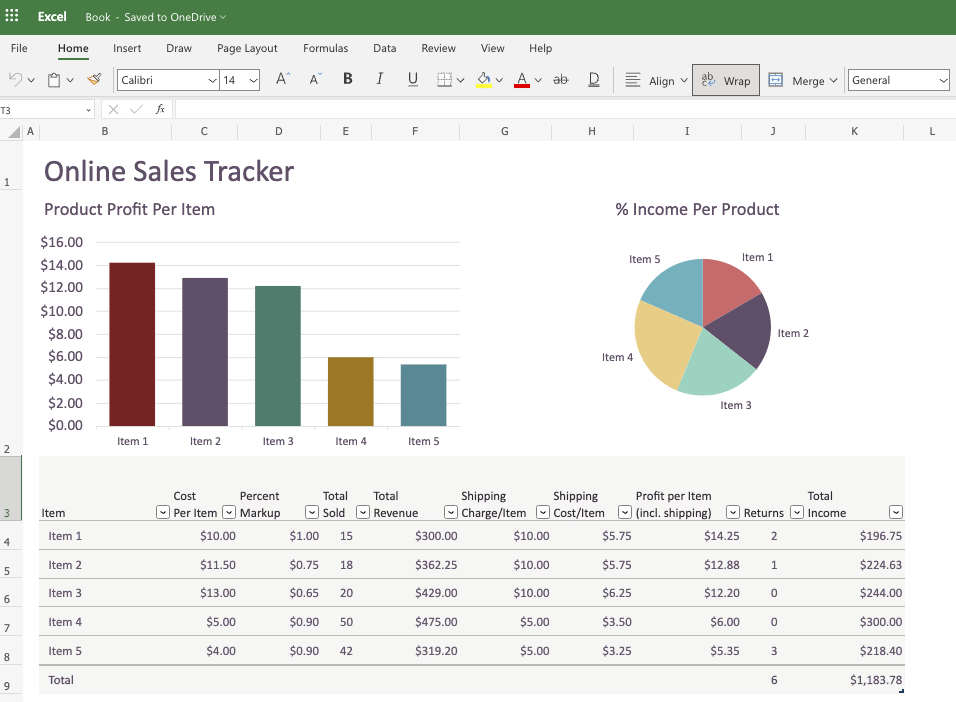
Excel Spreadsheets
“Excel files became a nightmare—outdated data, broken formulas, and hours wasted on formatting. AgentUI dashboards solved everything.”
AgentUI Dashboards
All your dashboards in one place
Transform your Excel data into stunning dashboards with real-time updates, interactive filters, and professional visualizations that work perfectly on any device.
5 Ways AgentUI transforms your Excel data into powerful dashboards
Instant Excel file upload and analysis
Simply drag and drop your Excel files. AI automatically detects data patterns and suggests the best dashboard layouts.
Smart chart generation from Excel data
AI creates beautiful charts and visualizations automatically based on your Excel data structure and content.
Real-time Excel data sync
Connect your Excel files for automatic updates. Your dashboards stay current without manual intervention.
Interactive dashboard sharing
Share your Excel-powered dashboards with your team or make them public with secure access controls.
How Excel to Dashboard Transformation Works
Upload your Excel file to AgentUI.
Simply drag and drop your .xlsx or .csv file. Our AI instantly analyzes your data structure, headers, and relationships.
AI automatically generates the perfect dashboard layout.
Our intelligent system identifies the best chart types, creates meaningful groupings, and suggests insights from your Excel data.
Customize and share your interactive dashboard instantly.
Make adjustments with our intuitive editor, then share with your team. Your dashboard updates automatically when you upload new Excel files.
AI Analyzes Your Excel Structure Instantly
Upload any Excel file and our AI automatically detects columns, data types, and relationships. It understands your data structure and suggests the best chart types and dashboard layouts.
Get a Professional Dashboard in Seconds
Your messy spreadsheet becomes a polished, interactive dashboard with charts, KPIs, trend analysis, and AI-powered insights — no design skills needed.
Your Dashboard Stays in Sync with Your Data
When your Excel data changes, your dashboard updates automatically. Set up scheduled refreshes or trigger updates via API for always-current insights.
Connect with Your Favorite Tools
Seamlessly integrate with the tools you already use


And 20+ more integrations
View all integrationsWho's Transforming Excel to Dashboards Today?
Finance Teams
Convert monthly Excel reports into live dashboards with real-time financial metrics and automated insights.
Sales Operations
Transform Excel sales data into interactive dashboards with pipeline tracking and performance analytics.
Marketing Teams
Convert Excel campaign data into visual dashboards showing ROI, conversion rates, and customer journey metrics.
Operations Managers
Transform Excel operational data into real-time dashboards for process monitoring and efficiency tracking.
Stop spending hours formatting Excel charts that look like they're from 1995. Let AI transform your spreadsheets into beautiful, interactive dashboards that actually help you make decisions.
Excel to Dashboard Results
Average Conversion Time
Excel Data Accuracy
Dashboard Adoption Rate
Ready to transform your Excel files into powerful dashboards?
Free Excel transformation. Keep everything you build.
Need help? Our AI experts will transform your first Excel file into a dashboard live on the call—completely free.
Schedule Free ConsultationFrequently Asked Questions
Answers to the most common questions about Excel dashboards and AI.
How do I create a dashboard in Excel?
Creating a dashboard in Excel starts with organizing your raw data into clean, structured tables. Each column should have a clear header, and your data should not contain merged cells or inconsistent formatting...
How to create a dashboard in Excel using AI?
Using AI to create a dashboard in Excel is becoming more practical as new tools integrate directly with spreadsheet workflows. Instead of manually selecting data ranges...
How to make a dashboard in Microsoft Excel?
Making a dashboard in Microsoft Excel follows a straightforward process, but doing it well requires careful planning before you touch any chart or formula...
Can ChatGPT create dashboards?
ChatGPT can help you plan and partially build dashboards, but it cannot create a fully functional, interactive dashboard on its own...
Which AI can generate dashboards?
Several AI tools can generate dashboards today, but they vary widely in what they produce and how useful the results are for day-to-day business use...
Share Dashboards That Win the Room
Go from raw Excel data to a polished PowerPoint or PDF in minutes. Walk into any meeting with presentation-ready dashboards your stakeholders will actually use.
Look Professional Instantly
Stop spending hours formatting slides. Pick a theme and your exports come out polished, on-brand, and ready to present.
Tell the Full Story
Add context around your charts — headlines, key takeaways, and bullet points — so your audience gets the insight, not just the data.
Exports That Just Work
No broken charts or missing data. Every export renders correctly the first time, so you never scramble before a meeting.