Excel dashboards have become essential for businesses to visualize data and make informed decisions. With AI-powered tools, creating professional dashboards from Excel files is now faster and more intuitive than ever. In this comprehensive guide, we'll explore the best AI tools for Excel dashboard creation, comparing their features, strengths, and ideal use cases.
1. AgentUI
The All-in-One AI Dashboard Solution
AgentUI stands out as the most comprehensive AI tool for Excel dashboard creation, combining automated data cleaning, smart visualization recommendations, and predictive analytics in one intuitive interface.
Key Advantages
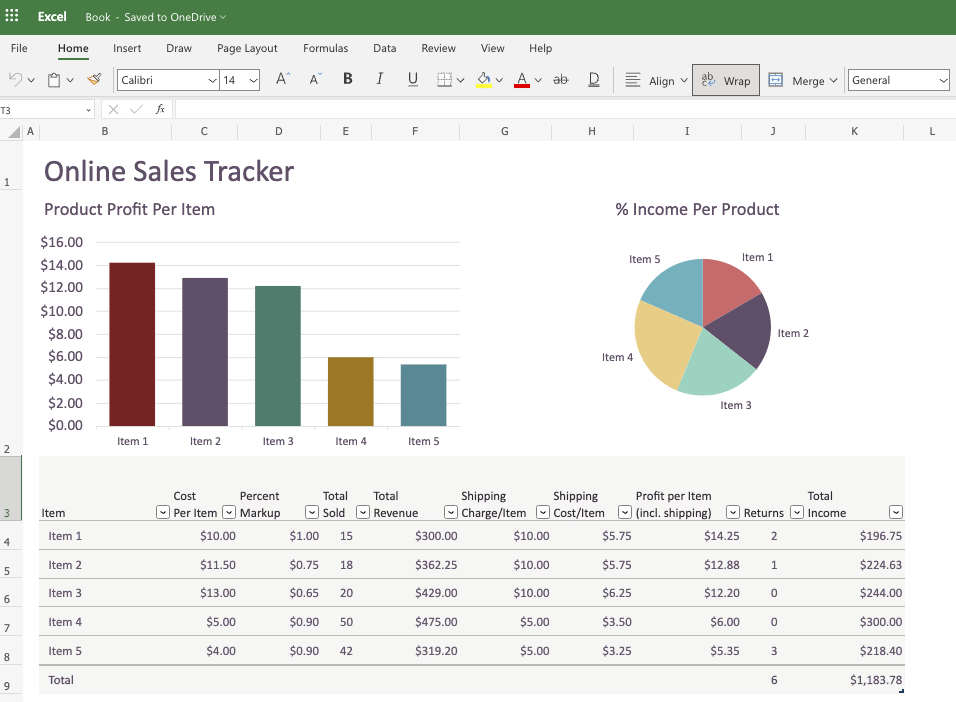
- ✓One-Click Automation: Upload any Excel file, and AgentUI's AI instantly suggests optimal chart types and dashboard layouts based on your data structure
- ✓Natural Language Processing: Ask questions like "Show sales trends by region" and get AI-generated visualizations
- ✓Collaboration Features: Share interactive dashboards with stakeholders who can explore data without Excel expertise
- ✓Predictive Modeling: Built-in forecasting tools project trends 3x faster than manual analysis
Why it stands out
Unlike tools requiring complex integrations, AgentUI works directly with your existing Excel files—no coding or data science skills needed. It's particularly valuable for SMEs that need enterprise-grade analytics without the enterprise-level complexity.
2. DataRobot
Advanced Predictive Analytics
For teams needing machine learning capabilities within Excel dashboards, DataRobot automates predictive modeling.
Strengths
- ✓Automated data cleaning and feature engineering
- ✓Forecast future trends directly in Excel
- ✓Best for: Financial modeling, inventory forecasting
3. Tableau
Visualization Powerhouse
Tableau's AI-driven insights help uncover hidden patterns.
Notable Features
- ✓Natural language querying ("Show me quarterly sales by product")
- ✓Stunning interactive visuals
- ✓Best for: Large enterprises with dedicated analytics teams
4. Microsoft Power BI
Seamless Office Integration
Power BI shines for Microsoft ecosystem users.
Key Benefits
- ✓"Quick Insights" auto-detects data patterns
- ✓Direct Excel data connection
- ✓Best for: Organizations standardized on Microsoft 365
5. Qlik Sense
Associative Data Exploration
Qlik's AI suggests optimal visualization paths.
Differentiators
- ✓Associative engine finds non-obvious data relationships
- ✓AI-guided dashboard creation
- ✓Best for: Exploratory data analysis
Implementation Guide: How to Choose Your AI Dashboard Tool
When evaluating solutions, consider:
Data Complexity
AgentUI handles everything from simple sales reports to multi-source operational data
User Skill Level
Our platform requires no training, while tools like DataRobot need data science basics
Collaboration Needs
AgentUI's shareable dashboards outperform emailing static Excel files
Budget
We offer transparent pricing without hidden per-user fees common in enterprise tools
For most businesses, AgentUI provides the ideal balance of power and accessibility. Start with our free trial to experience AI-driven dashboard creation—you'll be amazed how much time your team saves while gaining deeper insights.
The future of Excel analytics isn't about working harder with spreadsheets, but working smarter with AI. Which tool will you choose to transform your data into decisions?