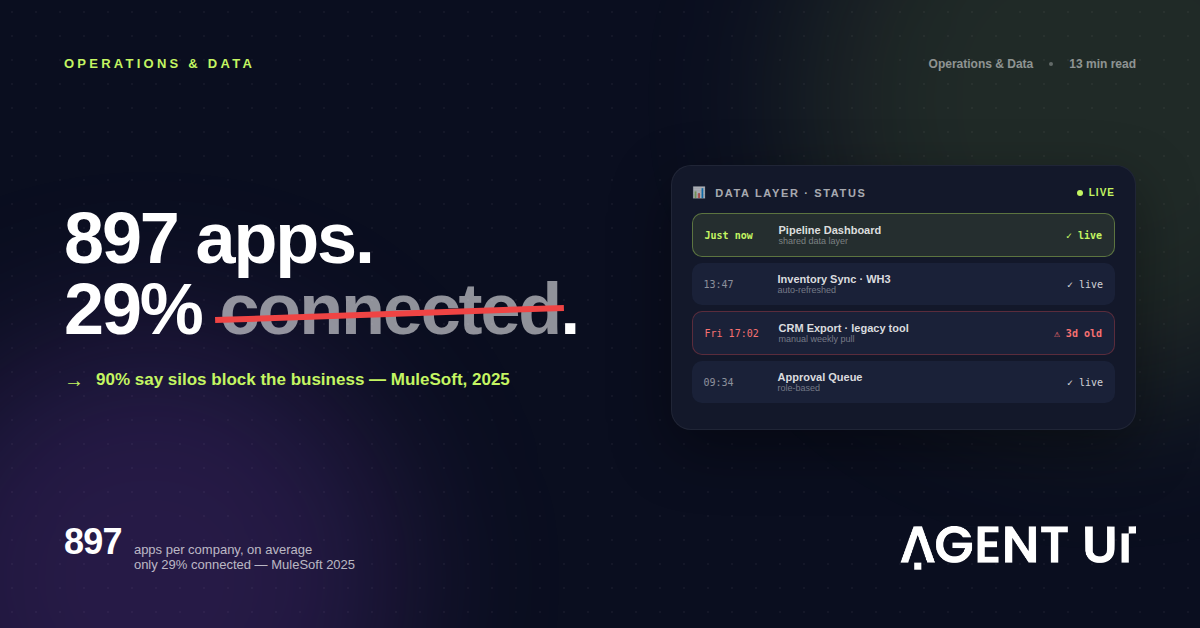
MuleSoft's 2025 Connectivity Benchmark Report found the average enterprise now runs 897 applications, but only 29% of them are actually connected — and 90% of organizations say those silos create real business obstacles. IBM's research backs up what that costs in practice: 80% of organizations still make decisions on outdated data, and 85% of data leaders admit that decision has already cost their company money. For sales operations specifically, Validity's 2025 State of CRM Data Management report found 76% of companies say less than half their CRM data is accurate, and 37% have lost revenue directly because of it. The fix isn't a prettier BI dashboard bolted on top of the same disconnected exports — it's a shared data layer underneath every app and report, so 'real time' actually means real time.
Every operations manager and sales ops manager has had the same conversation with a dashboard: it says one thing, reality says another, and nobody can agree on which one to trust. Usually it isn't the dashboard's fault. It's pulling from a spreadsheet that was last updated Tuesday, or a CRM export that ran overnight, or an inventory count someone typed in from a different system entirely. The chart looks confident. The number underneath it is already old. That gap between what a dashboard shows and what's actually true right now has a name in the research: the real-time visibility gap, and in 2026 it's one of the most expensive, least-discussed problems in operations.
The Lag Nobody Approved
IBM's research on delayed data puts a number on a feeling every operations manager already has: decisions are getting more frequent and more complex, but the data underneath them isn't keeping pace. IBM found that 71% of organizations report decision-making demands becoming more frequent, rapid, and complex — while 80% are still making those calls on data that's already stale by the time anyone looks at it. The most damaging number is the one that connects cause to effect directly: 85% of data leaders admit that a decision made with outdated data has already cost their company money.
That 85% figure matters because it isn't hypothetical. It's not "data delays could theoretically cause a problem someday." It's four out of five data leaders looking back and identifying a specific decision — a reorder that shipped too late, a rep who chased a deal that had already gone cold, a staffing call made on last week's volume instead of this week's — and tracing the cost directly back to a number that was wrong by the time it mattered.
The uncomfortable part is that most teams already know their dashboards lag. They just don't have a way to describe how much it's costing them, so it gets treated as a minor inconvenience — "the report is a day behind" — rather than what it actually is: a standing decision to run the business on information that's already out of date.
897 Apps, 29% Connected: Where the Gap Actually Comes From
The visibility gap isn't a reporting problem. It's a plumbing problem. MuleSoft's 2025 Connectivity Benchmark Report — based on interviews with 1,050 IT leaders, produced with Vanson Bourne and Deloitte Digital — found the average enterprise now manages 897 separate applications. Only 29% of them are actually integrated with each other. Just 2% of organizations have more than half their application stack connected. And 90% of organizations say data silos are creating real business obstacles, not theoretical ones.
Every one of those 897 apps was a reasonable purchase at the time — a CRM for sales, a spreadsheet for inventory, a separate tool for approvals, another for support tickets, another for scheduling. None of them were built to talk to each other, because none of them were bought as part of a single system. They were bought one department, one problem, and one budget cycle at a time. The dashboard that's supposed to summarize "the business" is trying to describe a system that was never actually built as one.
This is why adding another dashboard tool rarely fixes the lag. A BI tool pointed at the same 897 disconnected apps still has to wait for someone to export a CSV, run a nightly sync, or manually reconcile two systems that don't share a definition of "customer" or "SKU." You get a better-looking chart. You don't get a faster truth.
The Sales Ops Case: When the CRM Itself Is the Silo
For a sales operations manager, the visibility gap usually shows up as a specific, familiar complaint: "my CRM, my reporting, and my ops data don't talk to each other." Validity's 2025 State of CRM Data Management report found that 90% of organizations consider CRM data the cornerstone of their operations — but 76% say less than half of that data is actually accurate and complete. The gap between how much a company relies on its CRM and how much it can actually trust it is enormous, and it's the reporting layer sitting on top of the CRM that inherits the damage.
The financial impact isn't abstract. Validity found that 37% of CRM users report losing revenue directly because of poor data quality, that companies lose an average of 16 sales deals per quarter to bad data, and that 44% of companies see annual revenue losses exceeding 10% tied to CRM decay. B2B contact data decays at roughly 22.5% per year — nearly a quarter of a CRM's records go stale in twelve months without active correction.
It also isn't free to maintain. Netguru's research on disconnected sales tech stacks found reps spend close to 8 hours a week searching for, entering, or moving data between systems, and roughly 7 more hours a week making decisions based on what that data says — together, more than a third of a working week spent compensating for tools that don't talk to each other, on top of actually selling.
A pipeline report built on top of that CRM isn't wrong because someone made a mistake. It's wrong because the source data it's summarizing was already wrong, and no dashboard tool — however well designed — can report accuracy it was never given.
Why a New BI Tool Doesn't Fix It
The instinctive fix is to buy a dashboarding layer — connect a BI tool to the CRM, the inventory system, and the ops spreadsheet, and let it stitch together a single view. It's a reasonable instinct, and it's also how most companies end up with app number 898. The new tool still depends on nightly syncs, manual CSV exports, and connectors that break every time a source system changes a field name. It reports faster, but it's still reporting on data that was already stale before it arrived.
The actual fix has to happen one layer down, at the data itself: the CRM, the inventory table, the approval log, and the report all need to read from and write to the same underlying source, so there's no export step, no nightly batch job, and no second definition of "customer" to reconcile. That's a different kind of platform than a dashboard tool — it's a shared data layer that every app in the operation is built on top of, not bolted onto.
What Real-Time Visibility Actually Requires
This is the architecture problem AgentUI is built to solve. Every app an operations or sales ops manager builds on AgentUI — the CRM view, the inventory tracker, the approval workflow, the KPI dashboard — shares the same underlying database, integrations, and secrets. There's no export from one app to import into another, because they were never separate systems to begin with. A dashboard built on AgentUI isn't summarizing yesterday's sync; it's querying the same live data the CRM and the ops tools are writing to right now.
That shared core also carries the controls a manager actually needs to trust what they're looking at: role-based access so a rep sees their own pipeline and a director sees the rollup, audit logs on every change so a number nobody can explain has a trail back to who touched it and when, and multi-location support so a dashboard covering three warehouses or five sales territories is one live view instead of three exports someone has to merge by hand every Monday morning.
The Same Pipeline Review, Two Very Different Mornings
Picture a sales operations manager running a Monday pipeline review across four regional teams. In the disconnected version of this workflow, each region exports its CRM data Friday afternoon, someone spends part of Monday morning reconciling four spreadsheets that define "qualified lead" slightly differently, and by the time the review starts at 10am, the numbers already describe last week — not the three deals that closed or died since Friday's export.
Now picture the same review built on a shared data layer. The pipeline dashboard queries the CRM directly, region by region and rolled up together, refreshed continuously rather than exported once a week. There's no reconciliation step, because there was never a second copy of the data to reconcile against. The Monday review starts with what's actually true on Monday morning — including whatever happened over the weekend — instead of a snapshot from five business days earlier.
The gap only compounds as the company grows. A disconnected setup adds a fifth export, a fifth spreadsheet, and a fifth set of definitions to reconcile with every new region. A connected one adds a fifth data source pointing at the same dashboard — the report doesn't get slower or less trustworthy as the business gets bigger, because the underlying architecture was never doing the reconciliation by hand in the first place.
Before You Trust Another Dashboard, Check For:
- Whether the dashboard queries live data or a scheduled export — ask how old the newest number on the screen actually is
- One definition of each entity (customer, SKU, deal stage) shared across every app and report, not a different definition per system
- Role-based access so different people see the right slice of the same live data, not separate exports with separate blind spots
- An audit trail on every record, so a number nobody can explain still has a traceable history
- Whether adding a new location, team, or data source means a new live connection or a new manual reconciliation step
- A human who can explain a discrepancy in the data, not just a support ticket that gets acknowledged and queued
The real-time visibility gap isn't a dashboard problem, and it doesn't get fixed by a better chart. It's a plumbing problem — 897 apps, 29% of them actually talking to each other, and every report in between inheriting the lag. MuleSoft's research says the gap is nearly universal. IBM's research says it's already costing four out of five data leaders real money. Validity's research says the CRM most sales ops teams treat as ground truth is, on average, less than half accurate.
Closing that gap means changing what sits underneath the dashboard, not just what sits on top of it. One shared database instead of 897 disconnected exports. One definition of a customer instead of four. A number that's true when you look at it, not true as of whenever the last sync ran.
The operations manager or sales ops manager staring at Monday's pipeline report doesn't need a faster export or a prettier chart. They need the report to be looking at the same data the business is actually running on, right now — not a summary of what was true when someone last remembered to hit refresh.