Transform Excel Spreadsheets into Interactive Dashboards — In Minutes, Not Hours
Stop manually building charts in Excel. Upload your spreadsheet and let AI instantly convert it into a stunning, interactive dashboard with real-time updates.
Trusted by over 500 companies worldwide to transform Excel data into professional dashboards.

Excel Chaos Is Holding Your Team Back
Your team spends hours each week updating Excel files, manually creating charts, and struggling with version control. Charts break, formulas fail, and data gets out of sync. Everyone ends up with different versions of the "latest" report.
Data teams and analysts deserve better than wrestling with Excel's limitations. You need dashboards that update automatically, look professional, and actually help people make decisions.
How Your Data Looks in Excel vs AgentUI Dashboards
Excel Spreadsheets

“Excel files became a nightmare—outdated data, broken formulas, and hours wasted on formatting. AgentUI dashboards solved everything.”
AgentUI Dashboards
All your dashboards in one place
Transform your Excel data into stunning dashboards with real-time updates, interactive filters, and professional visualizations that work perfectly on any device.
5 Ways AgentUI transforms your Excel data into powerful dashboards
Instant Excel file upload and analysis
Simply drag and drop your Excel files. AI automatically detects data patterns and suggests the best dashboard layouts.
Smart chart generation from Excel data
AI creates beautiful charts and visualizations automatically based on your Excel data structure and content.
Real-time Excel data sync
Connect your Excel files for automatic updates. Your dashboards stay current without manual intervention.
Interactive dashboard sharing
Share your Excel-powered dashboards with your team or make them public with secure access controls.
How Excel to Dashboard Transformation Works
Upload your Excel file to AgentUI.
Simply drag and drop your .xlsx or .csv file. Our AI instantly analyzes your data structure, headers, and relationships.
AI automatically generates the perfect dashboard layout.
Our intelligent system identifies the best chart types, creates meaningful groupings, and suggests insights from your Excel data.
Customize and share your interactive dashboard instantly.
Make adjustments with our intuitive editor, then share with your team. Your dashboard updates automatically when you upload new Excel files.
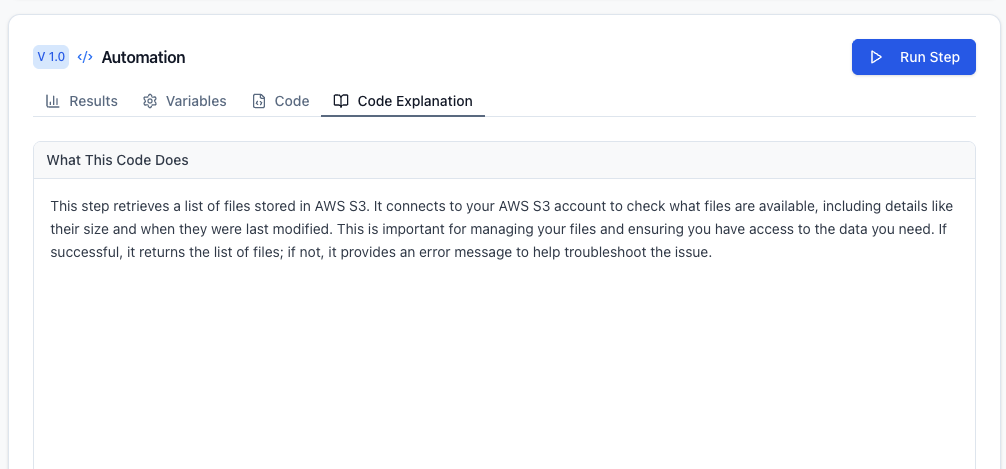
Smart Excel data interpretation with AI explanations
AI automatically understands your Excel structure and explains how it transforms your data into beautiful dashboard visualizations.
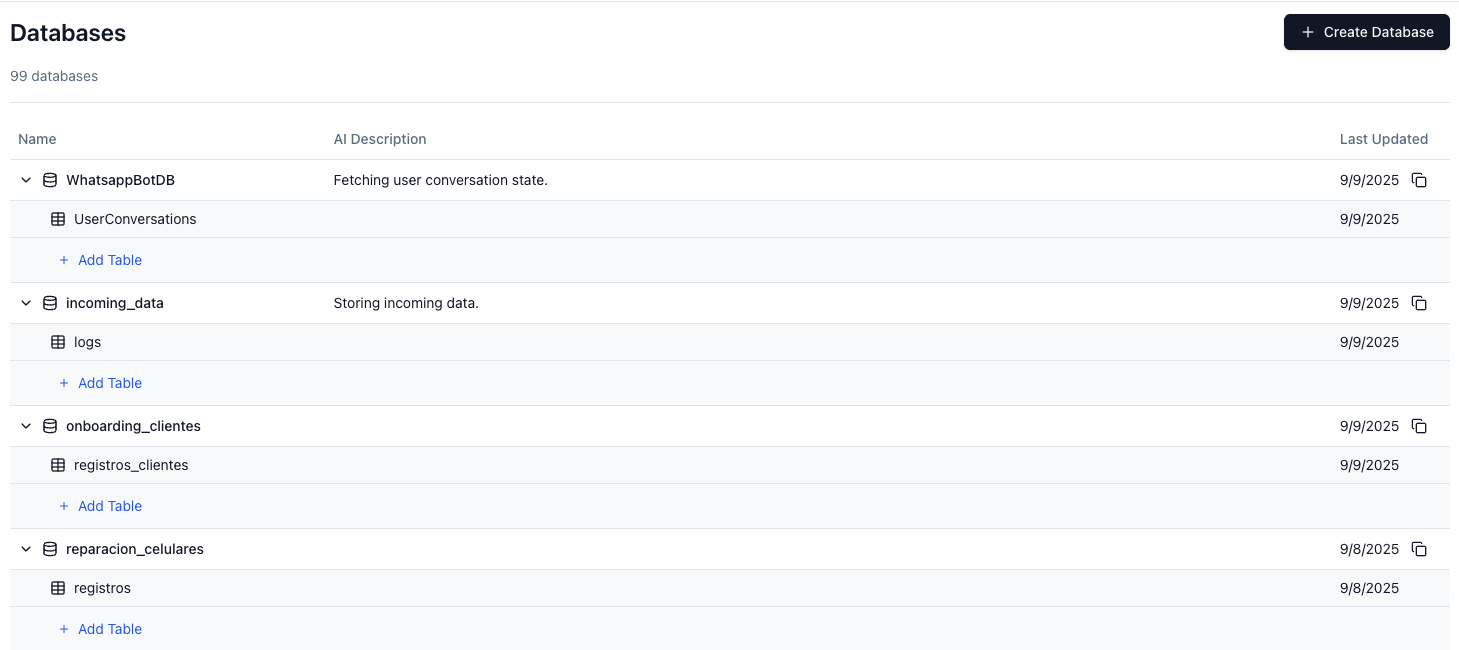
Seamless Excel data storage and management
Your Excel data is automatically stored in our secure database with optimized schemas for fast dashboard rendering and updates.
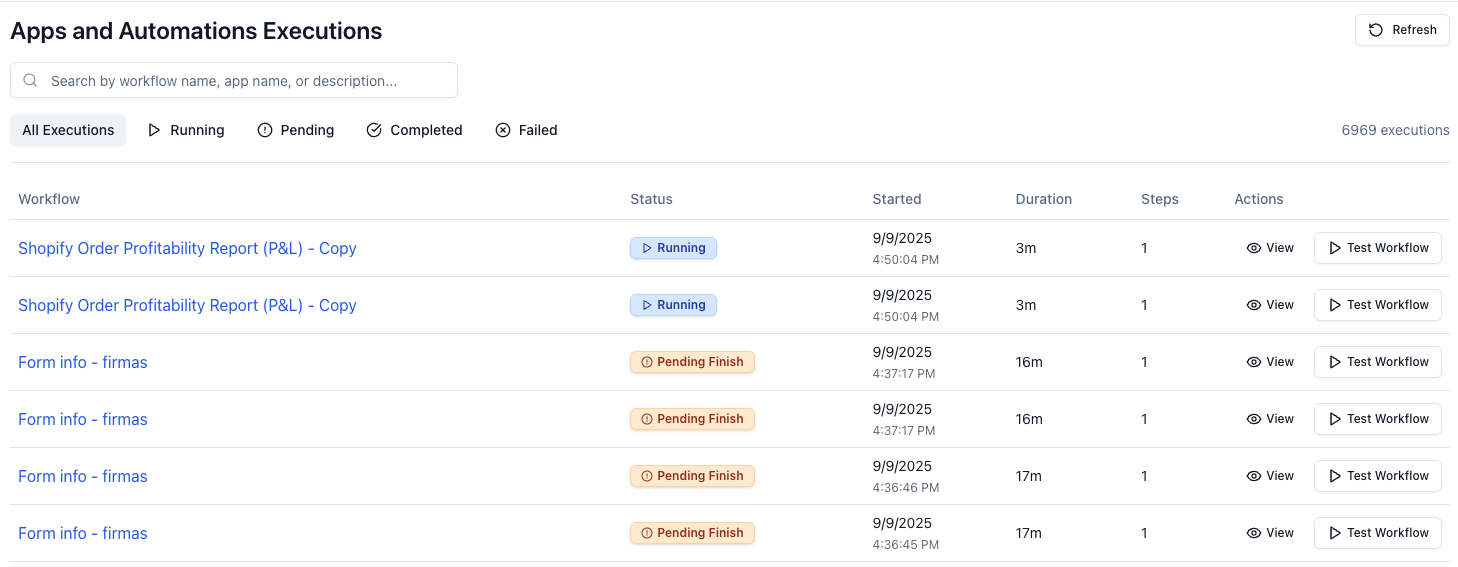
Real-time Excel dashboard monitoring
Monitor your Excel-powered dashboards with real-time analytics, performance metrics, and user engagement tracking.
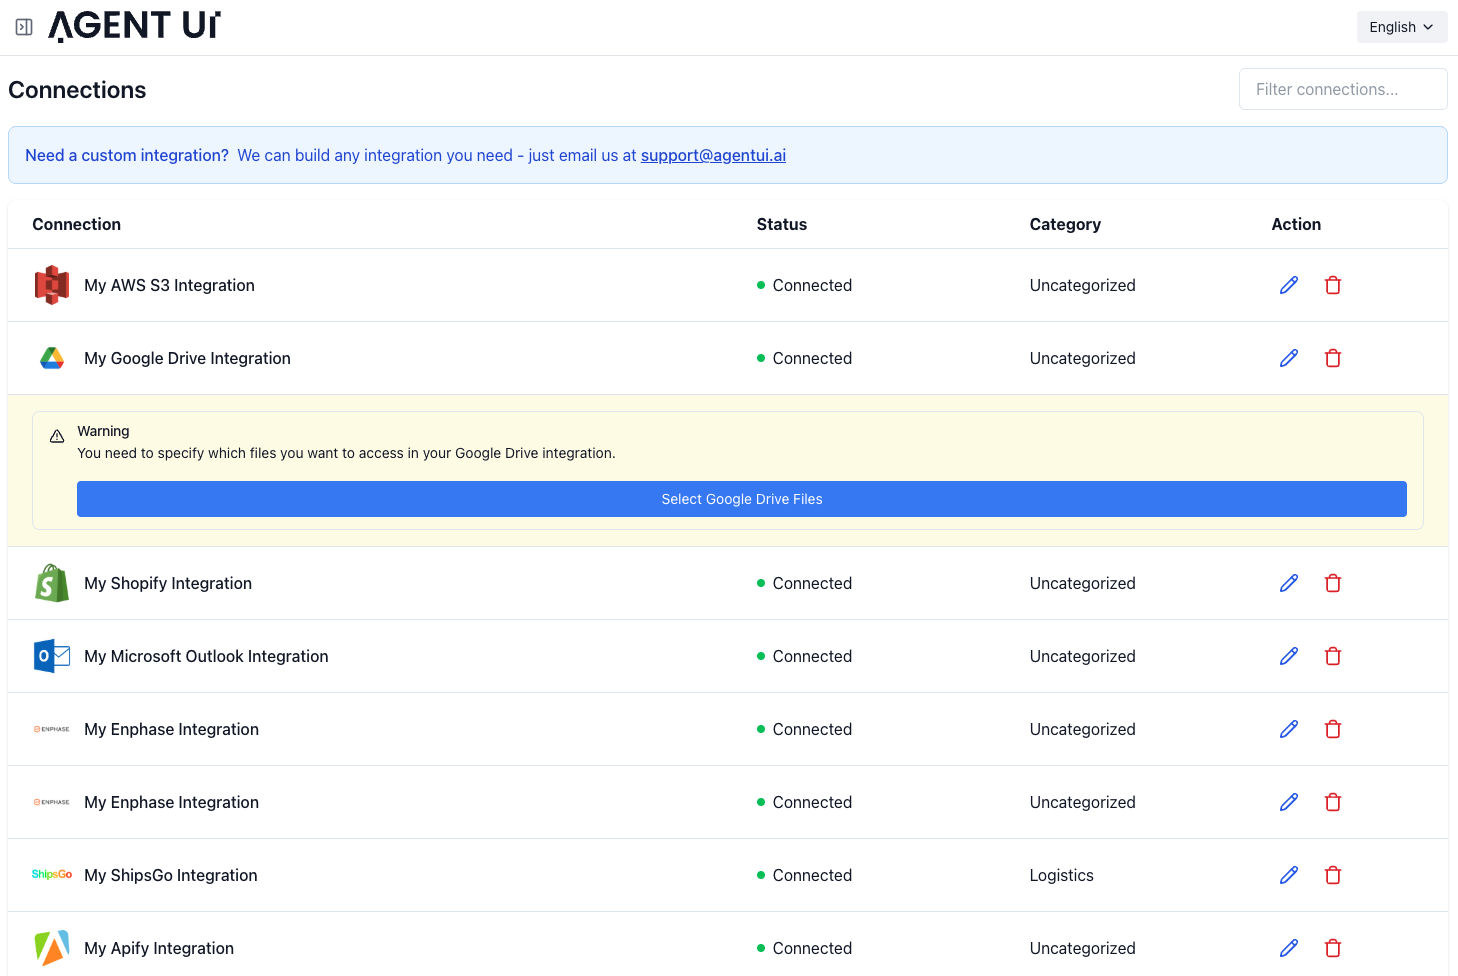
Excel integrations with your existing tools
Connect your Excel dashboards with existing business tools, databases, and APIs for comprehensive data visualization workflows.

API triggers for Excel data updates
Set up automated API triggers to update your Excel dashboards whenever new data is available from your systems.
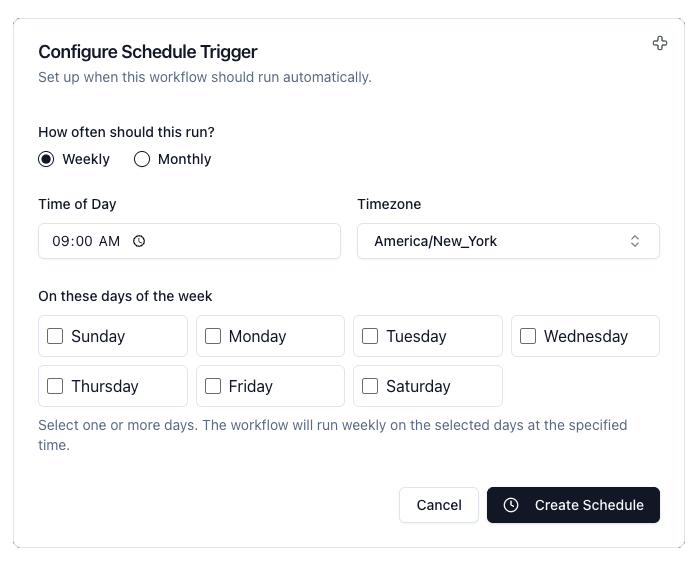
Scheduled Excel data refresh
Schedule automatic Excel file processing and dashboard updates on specific intervals to keep your data always current.
Who's Transforming Excel to Dashboards Today?
Finance Teams
Convert monthly Excel reports into live dashboards with real-time financial metrics and automated insights.
Sales Operations
Transform Excel sales data into interactive dashboards with pipeline tracking and performance analytics.
Marketing Teams
Convert Excel campaign data into visual dashboards showing ROI, conversion rates, and customer journey metrics.
Operations Managers
Transform Excel operational data into real-time dashboards for process monitoring and efficiency tracking.
Stop spending hours formatting Excel charts that look like they're from 1995. Let AI transform your spreadsheets into beautiful, interactive dashboards that actually help you make decisions.
Excel to Dashboard Results
Average Conversion Time
Excel Data Accuracy
Dashboard Adoption Rate
Ready to transform your Excel files into powerful dashboards?
Free Excel transformation. Keep everything you build.
Need help? Our AI experts will transform your first Excel file into a dashboard live on the call—completely free.
Schedule Free Consultation